In recent years, the cost of owning a home in Canada has skyrocketed, with only a minor correction due to consistent interest rate hikes in the past 10 months.
Despite this, wages have not kept up with the rapid increase in housing prices, raising concerns about the affordability of Canadian homes.
In light of this, the question remains: what salary is required to purchase a home in Canada, and are homes still within reach for the average Canadian?
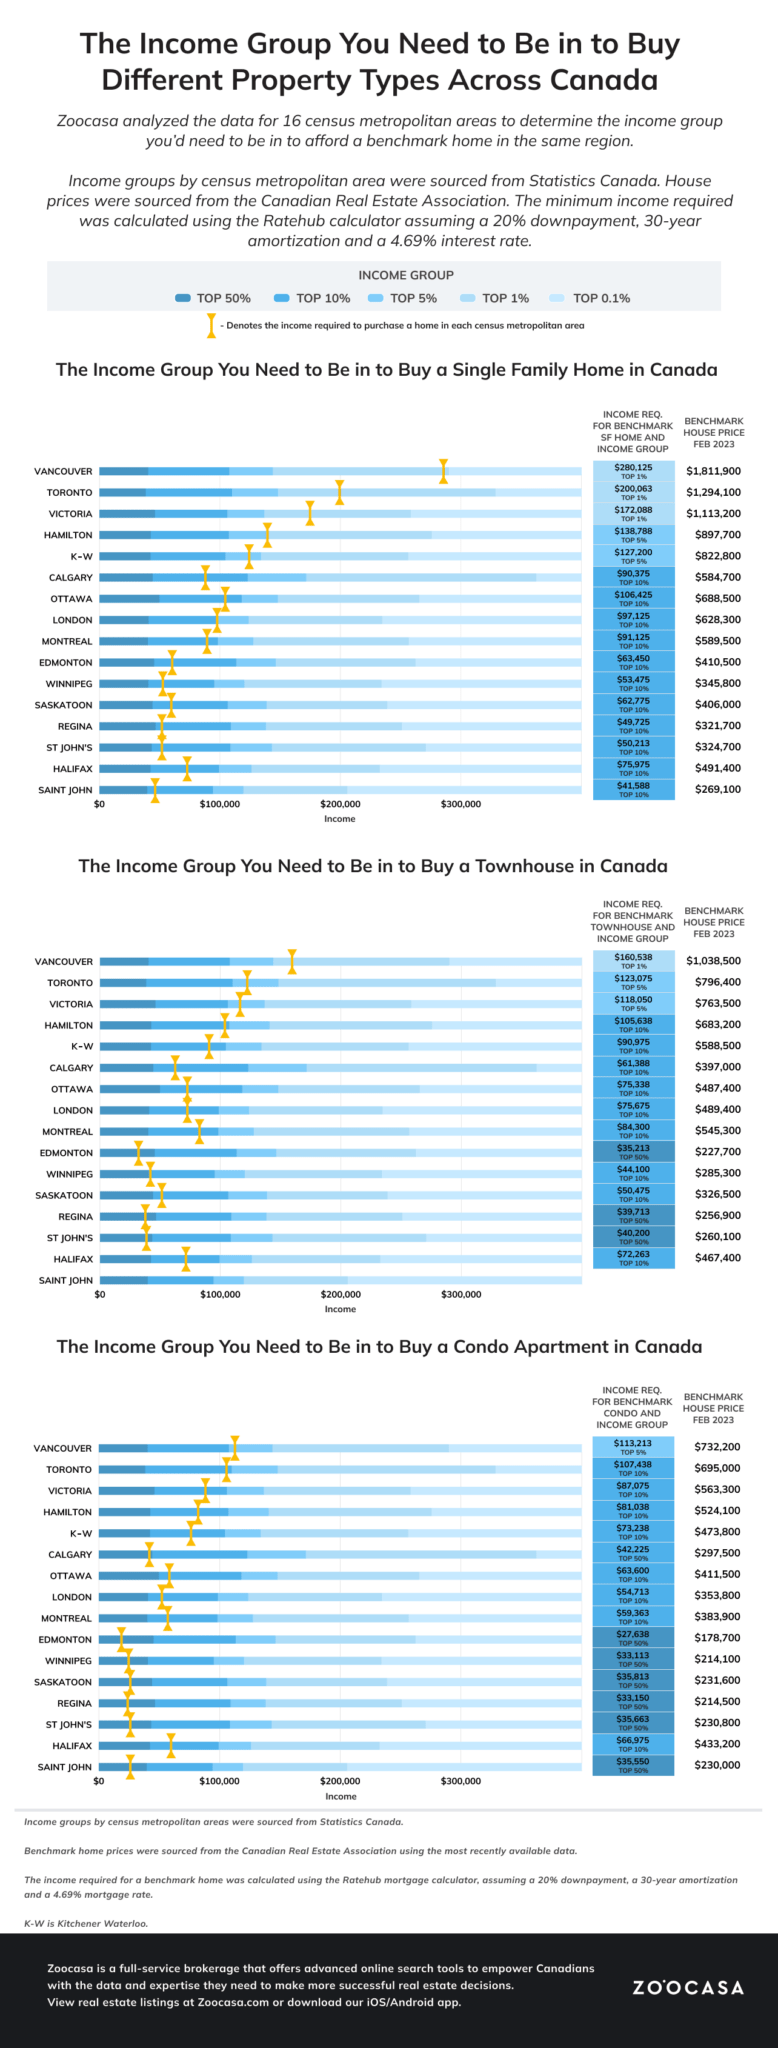
To shed light on this issue, Zoocasa analyzed 16 different census municipalities and compared the prices of single-family homes, townhouses, and condo apartments to different income groups, ranging from the top 50% of earners to the top 0.1%.

According to Zoocasa, homes on the East Coast and in the Prairies are generally more affordable than in Ontario and British Columbia. In Vancouver, Toronto, and Victoria, buyers would need to be in the top 1% of earners to afford a single-family home, meanwhile, in Montreal, Edmonton, Winnipeg, Saskatoon, Regina, St John’s, Halifax, and Saint John, buyers would need to be in the top 10% of earners to afford a single-family home.
The affordability gap is similar for townhouses, with buyers in Edmonton, Regina, and St John’s needing to be in the top 50% of earners to afford one. In contrast, a buyer in Vancouver would require an income of $160,538 to purchase a townhouse, which would place them in the top 1% of earners.
For condo apartments, buyers in Edmonton, Winnipeg, Saskatoon, Regina, St John’s, and Saint John would need to be in the top 50% of earners to afford one. The highest income required to afford a home is in Saskatoon, where an income of $35,518 is needed to afford a detached home. In Vancouver, a buyer would need to be in the top 5% of earners, with an income of $113,213 required to purchase an apartment.
It is important to note that income requirements vary between cities. While someone in the top 10% of earners in St. John would need an income of $41,588 to afford a home there, someone in Ottawa in the top 10% would require $106,425 to afford a home. The higher housing prices in certain cities mean that the required income levels for various income groups are also higher.
Here's a look at what income group you would need to be in to buy different homes in Ontario:
Single Family Home
Toronto:
- Income Required: $200,063
- Income Group: Top 1%
- Benchmark House Price: $1,294,100
Hamilton:
- Income Required: $138,788
- Income Group: Top 5%
- Benchmark House Price: $897,700
Kitchener-Waterloo:
- Income Required: $127,200
- Income Group: Top 5%
- Benchmark House Price: $822,800
London:
- Income Required: $97,125
- Income Group: Top 10%
- Benchmark House Price: $628,300
Townhouse
Toronto:
- Income Required: $123,075
- Income Group: Top 5%
- Benchmark House Price: $796,400
Hamilton:
- Income Required: $106,638
- Income Group: Top 10%
- Benchmark House Price: $683,200
Kitchener-Waterloo:
- Income Required: $90,975
- Income Group: Top 10%
- Benchmark House Price: $588,500
London:
- Income Required: $75,675
- Income Group: Top 10%
- Benchmark House Price: $489,400
Condo Apartment
Toronto:
- Income Required: $107,438
- Income Group: Top 10%
- Benchmark House Price: $695,000
Hamilton:
- Income Required: $81,038
- Income Group: Top 10%
- Benchmark House Price: $524,100
Kitchener-Waterloo:
- Income Required: $73,238
- Income Group: Top 10%
- Benchmark House Price: $473,800
London:
- Income Required: $54,713
- Income Group: Top 10%
- Benchmark House Price: $353,800
Zoocasa's analysis sought to determine how much income is required to afford a home at the benchmark price, as reflected in the income groups illustrated in the infographic below.